Problem Statement Link to heading
A common approach for autoscaling in Kubernetes is to scale based on resource consumption like CPU and memory. However, this isn’t always the most effective strategy. For many applications, resource usage might be low even when the number of requests is high, leading to increased latency and poor user experience. This can be a problem for services like web scrapers or APIs where a surge in traffic requires a corresponding increase in processing power, even if individual pod resource consumption remains low. To address this, a more intelligent autoscaling strategy is needed, one that scales based on the actual demand on the application, such as the number of requests per second.
Solution Overview Link to heading
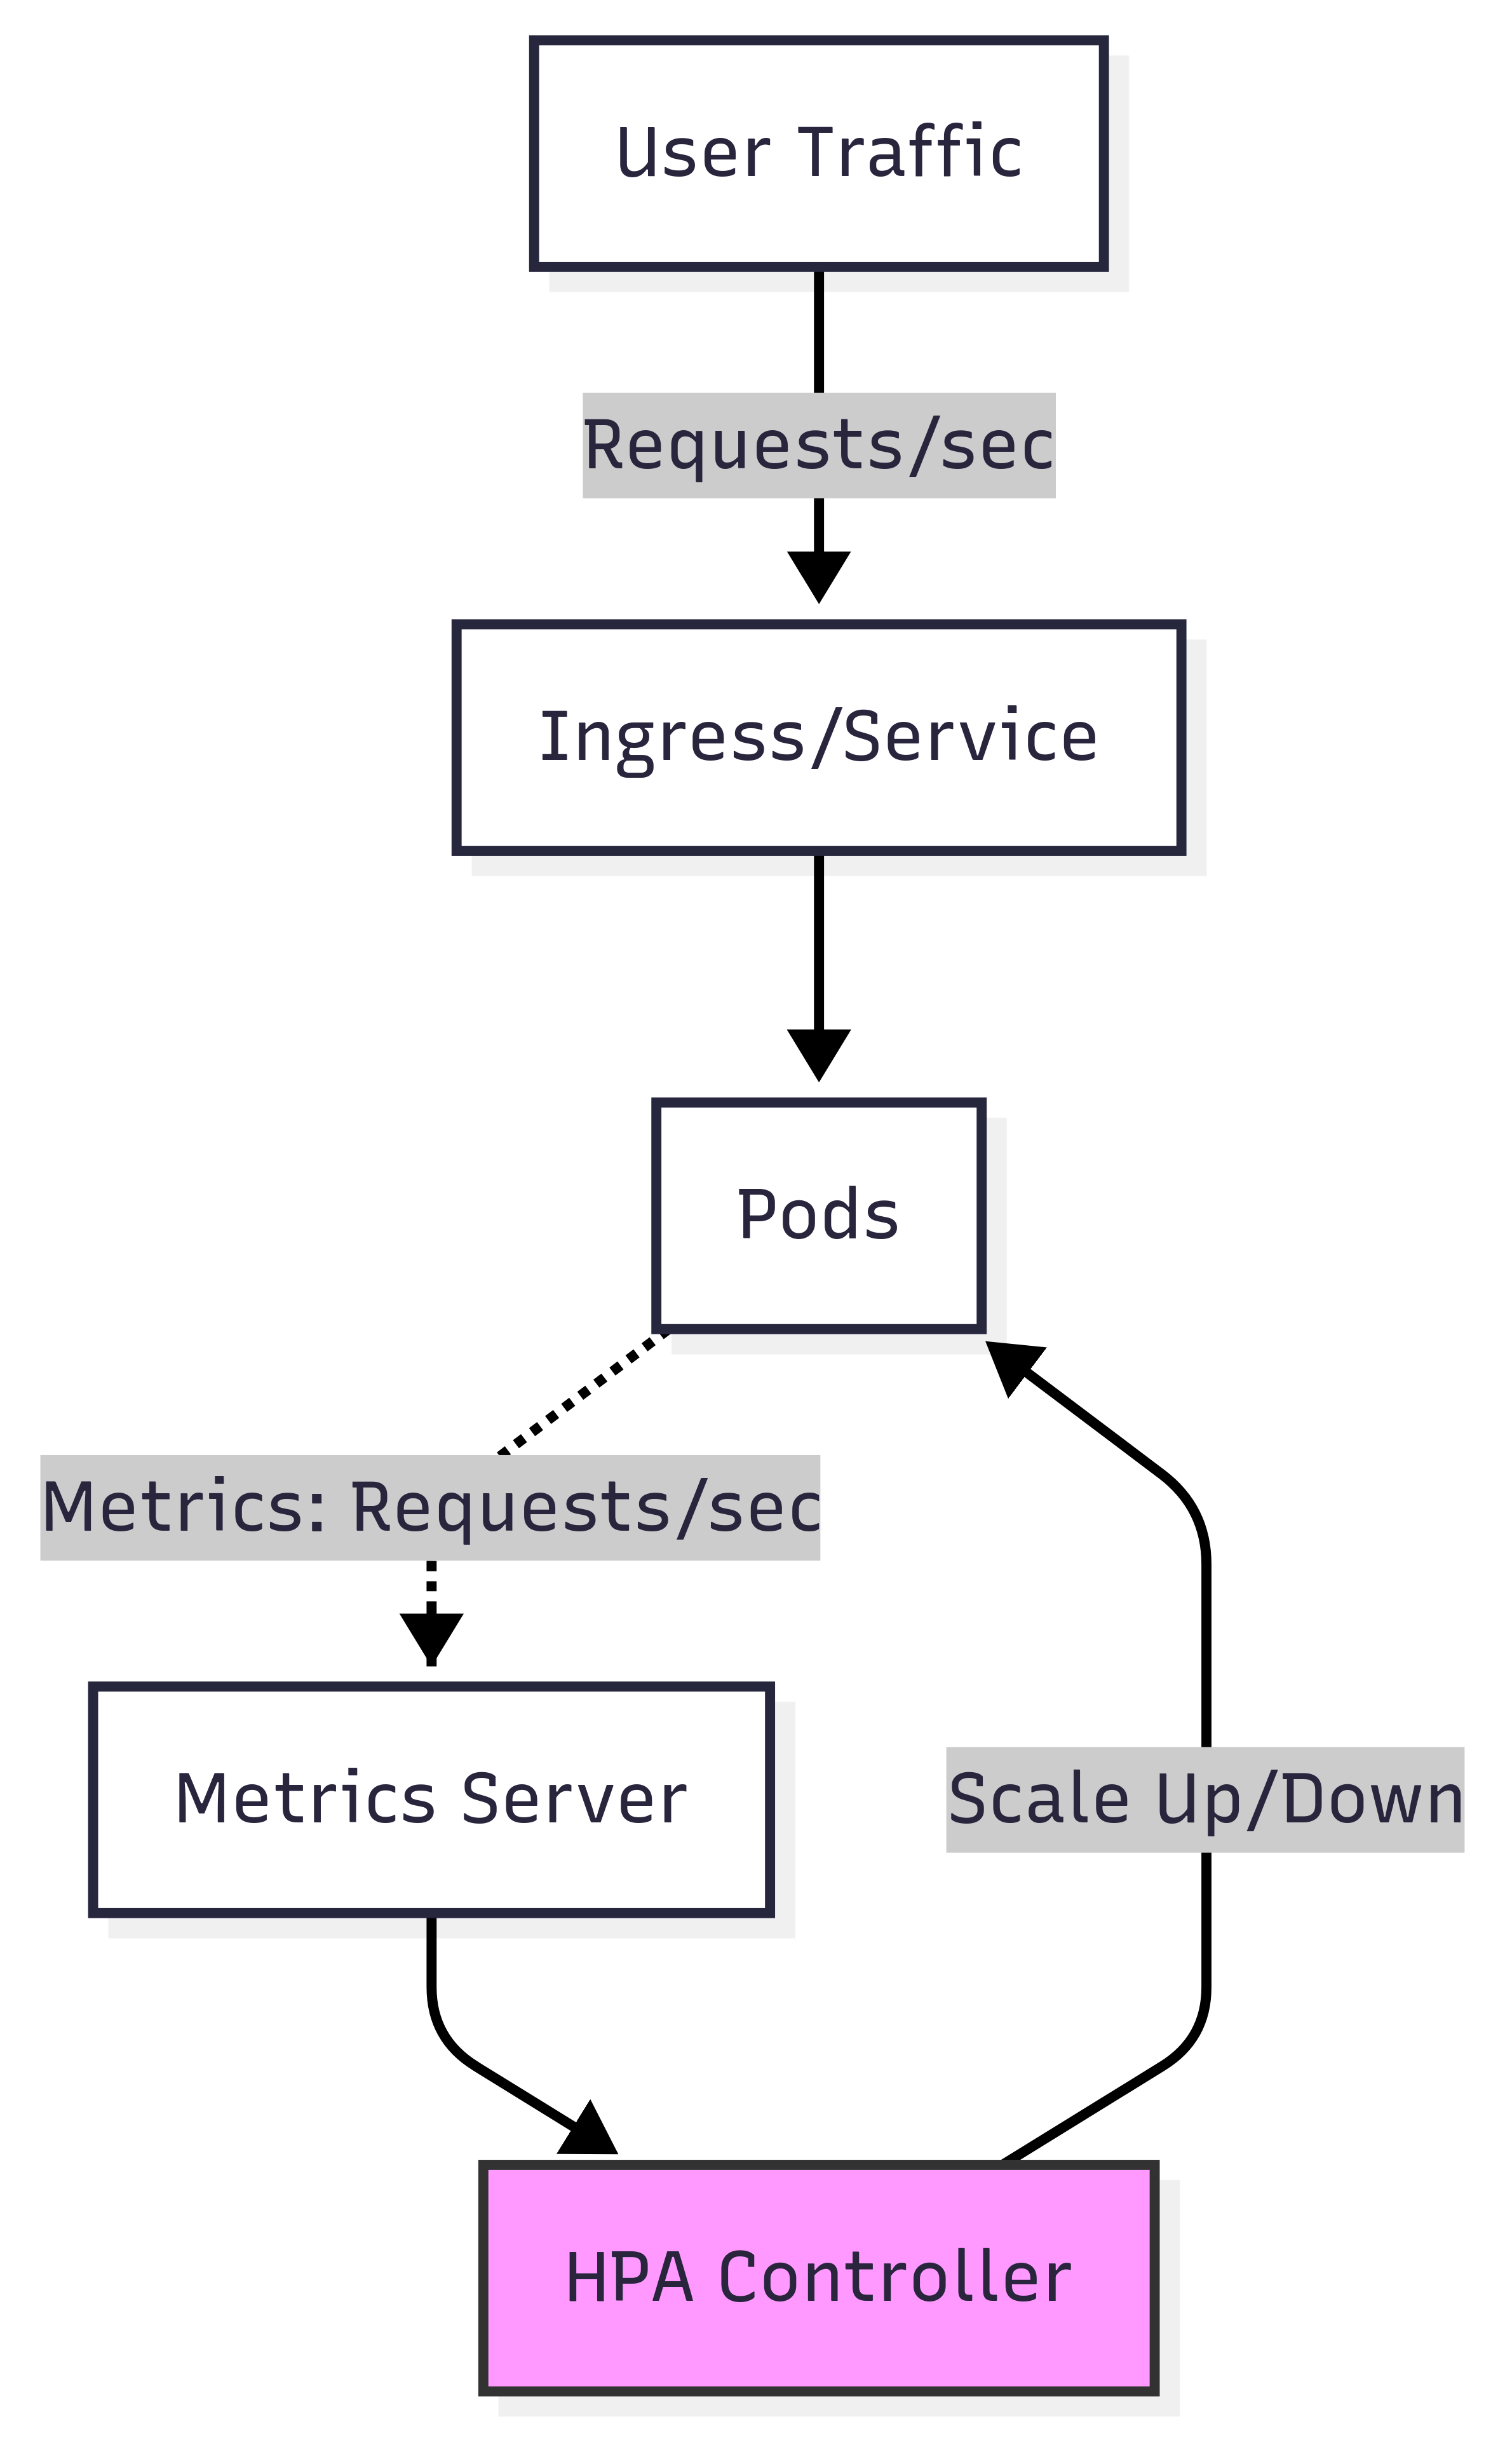
To solve this problem, we can autoscale based on the number of requests per second using custom metrics from Datadog. This approach ensures your services can handle fluctuating request loads, maintain low latency, and optimize resource usage.
First, we need to configure the Datadog Agent to expose a metrics server that the Horizontal Pod Autoscaler (HPA) can query. To do this, ensure you have the externalMetricsServer feature enabled in your DatadogAgent manifest. This tells the Datadog Operator to deploy the metrics server, which is crucial for HPA to work.
features:
  externalMetricsServer:
    enabled: true
    useDatadogMetrics: true
The useDatadogMetrics: true setting explicitly allows the metrics server to utilize Datadog metrics for scaling decisions.
Next, you need to define a DatadogMetric resource. This is a custom resource that queries Datadog’s API and makes a specific metric available for autoscaling. Create a new metric inside your Kubernetes namespace using the following format.
apiVersion: datadoghq.com/v1alpha1
kind: DatadogMetric
metadata:
  name: <DATADOG_METRIC_NAME>
spec:
  query: <CUSTOM_QUERY>
As an example, let’s create a metric to get the total number of FastAPI requests per minute for a service. This metric uses data reported by the Datadog tracing library.
apiVersion: datadoghq.com/v1alpha
kind: DatadogMetric
metadata:
  name: fastapi-requests-per-second
spec:
  query: per_minute(avg:trace.fastapi.request.hits{env:staging, service:<SERVICE_NAME>}.as_count())
This query counts the average number of trace.fastapi.request.hits per minute.
After creating the DatadogMetric, you can now define an HPA that uses this metric to scale your application. This HPA will monitor the metric and automatically adjust the number of pods based on the configured target value.
Here’s an example HPA manifest:
apiVersion: autoscaling/v2
kind: HorizontalPodAutoscaler
metadata:
  name: <service-name>-hpa
  namespace: <namespace>
spec:
  minReplicas: <minReplicas>
  maxReplicas: <maxReplicas>
  scaleTargetRef:
    apiVersion: apps/v1
    kind: Deployment
    name: <deployment-name>
  metrics:
  - external:
      metric:
        name: datadogmetric@<namespace-name>:fastapi-requests-per-second
      target:
        type: Value
        value: "<number-of-requests>"
    type: External
This HPA will scale if the number of requests per minute exceeds the target value you specify. The name field for the metric in the HPA must be in the format datadogmetric@<namespace-name>:<datadog-metric-name>.
Conclusion Link to heading
By leveraging Datadog’s custom metrics, you can move beyond traditional resource-based scaling and implement a more intelligent autoscaling strategy based on the specific needs of your application. This approach ensures your services can handle fluctuating request loads, maintain low latency, and optimize resource usage. By enabling the external metrics server, defining a DatadogMetric to track requests, and configuring an HPA to target that metric, you can create a robust and responsive system that scales in real-time with your application’s demand.